GridMind
AI that watches a solar fleet
Overview
A platform that brings the telemetry of thousands of panels, inverters and grid nodes into one command center, and predicts failures days ahead instead of reporting them once they have already happened.
The problem
A solar farm does not fail all at once. It degrades. An inverter starts running hotter than it should, one string of panels yields slightly under the one beside it, and none of that trips an alarm because, technically, everything is still working.
The problem is scale. Thousands of panels reporting telemetry every few seconds produce more readings than anyone can look at, so in practice nobody looks. By the time someone notices an inverter is underperforming, it has been underperforming for weeks, and what was lost in that time does not come back.
One command center for the whole fleet
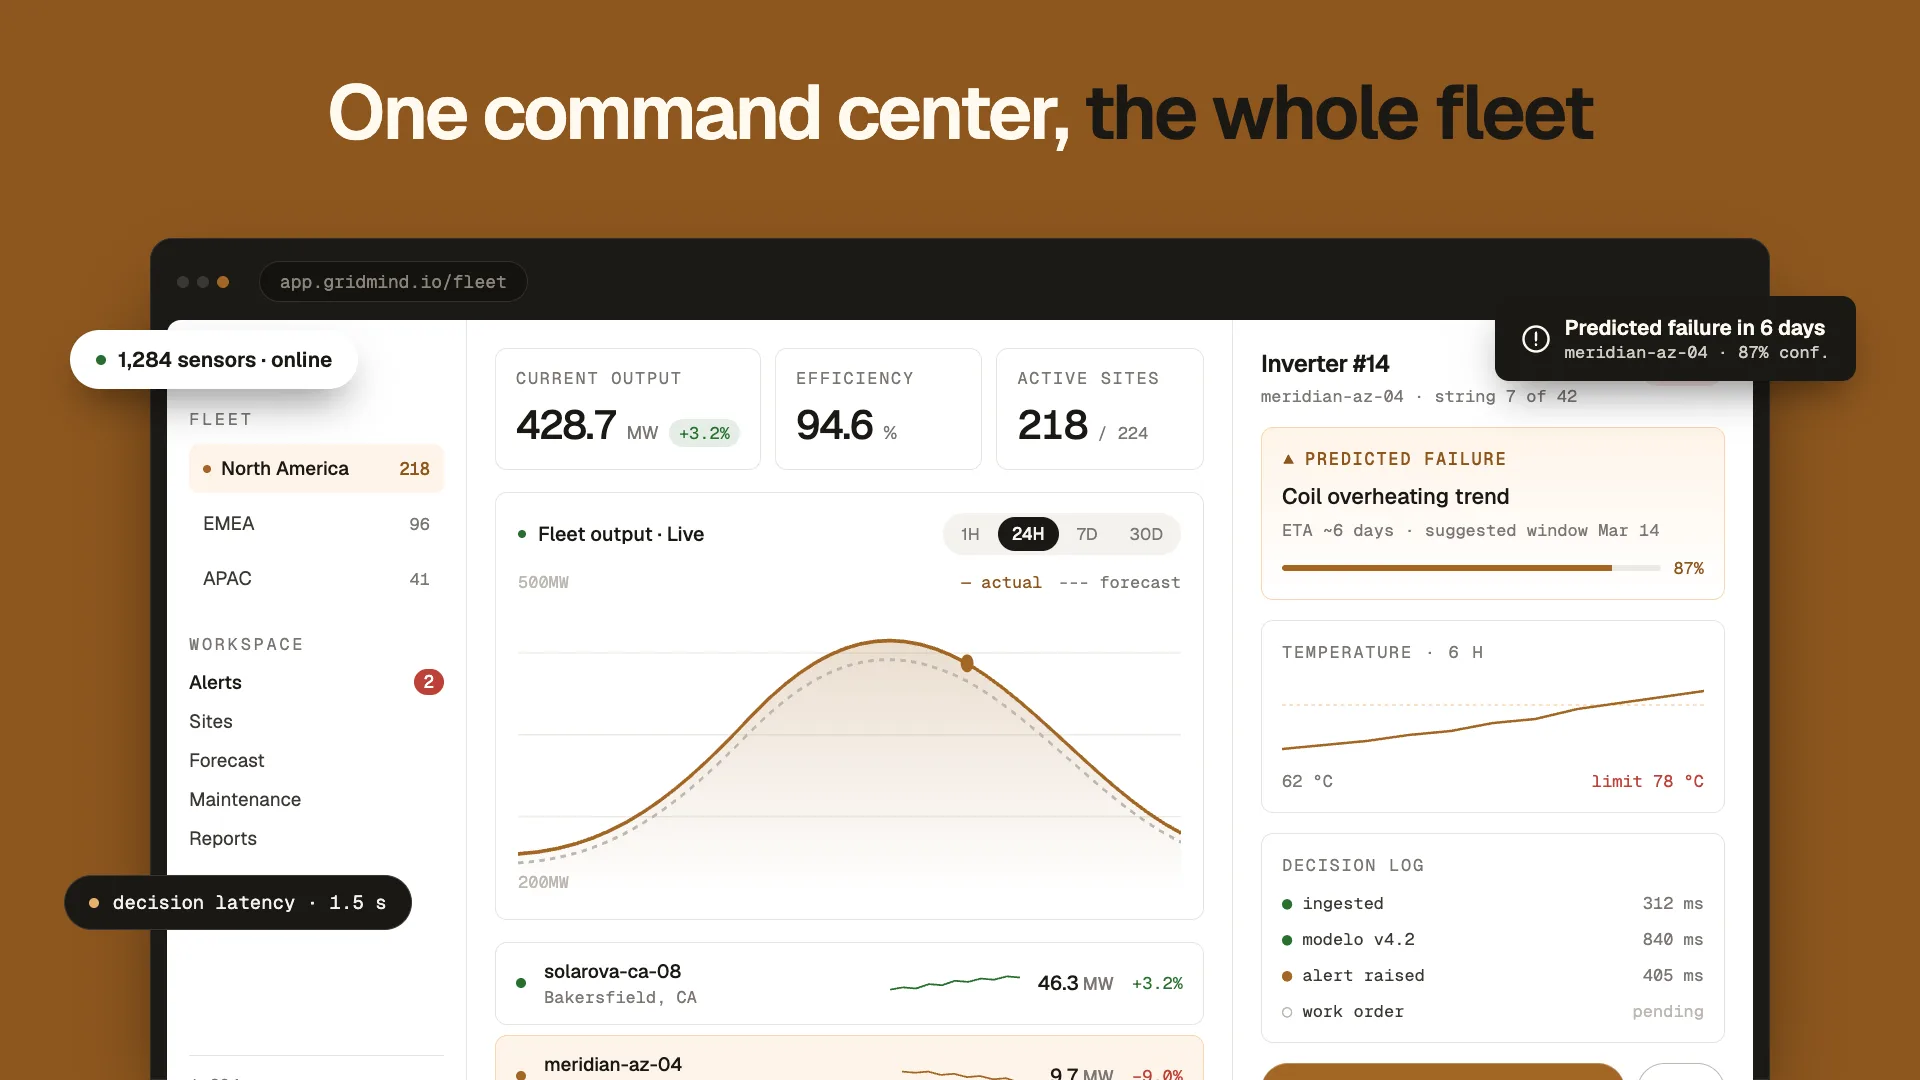
GridMind puts the entire fleet in a single view: current output, efficiency, active sites, and the curve of what was actually generated against what the model expected.
The panel on the right is the one that matters. It does not say something failed: it says something is going to fail, on which string, with how much confidence, and in which window it is worth sending a crew.
From sensor to work order
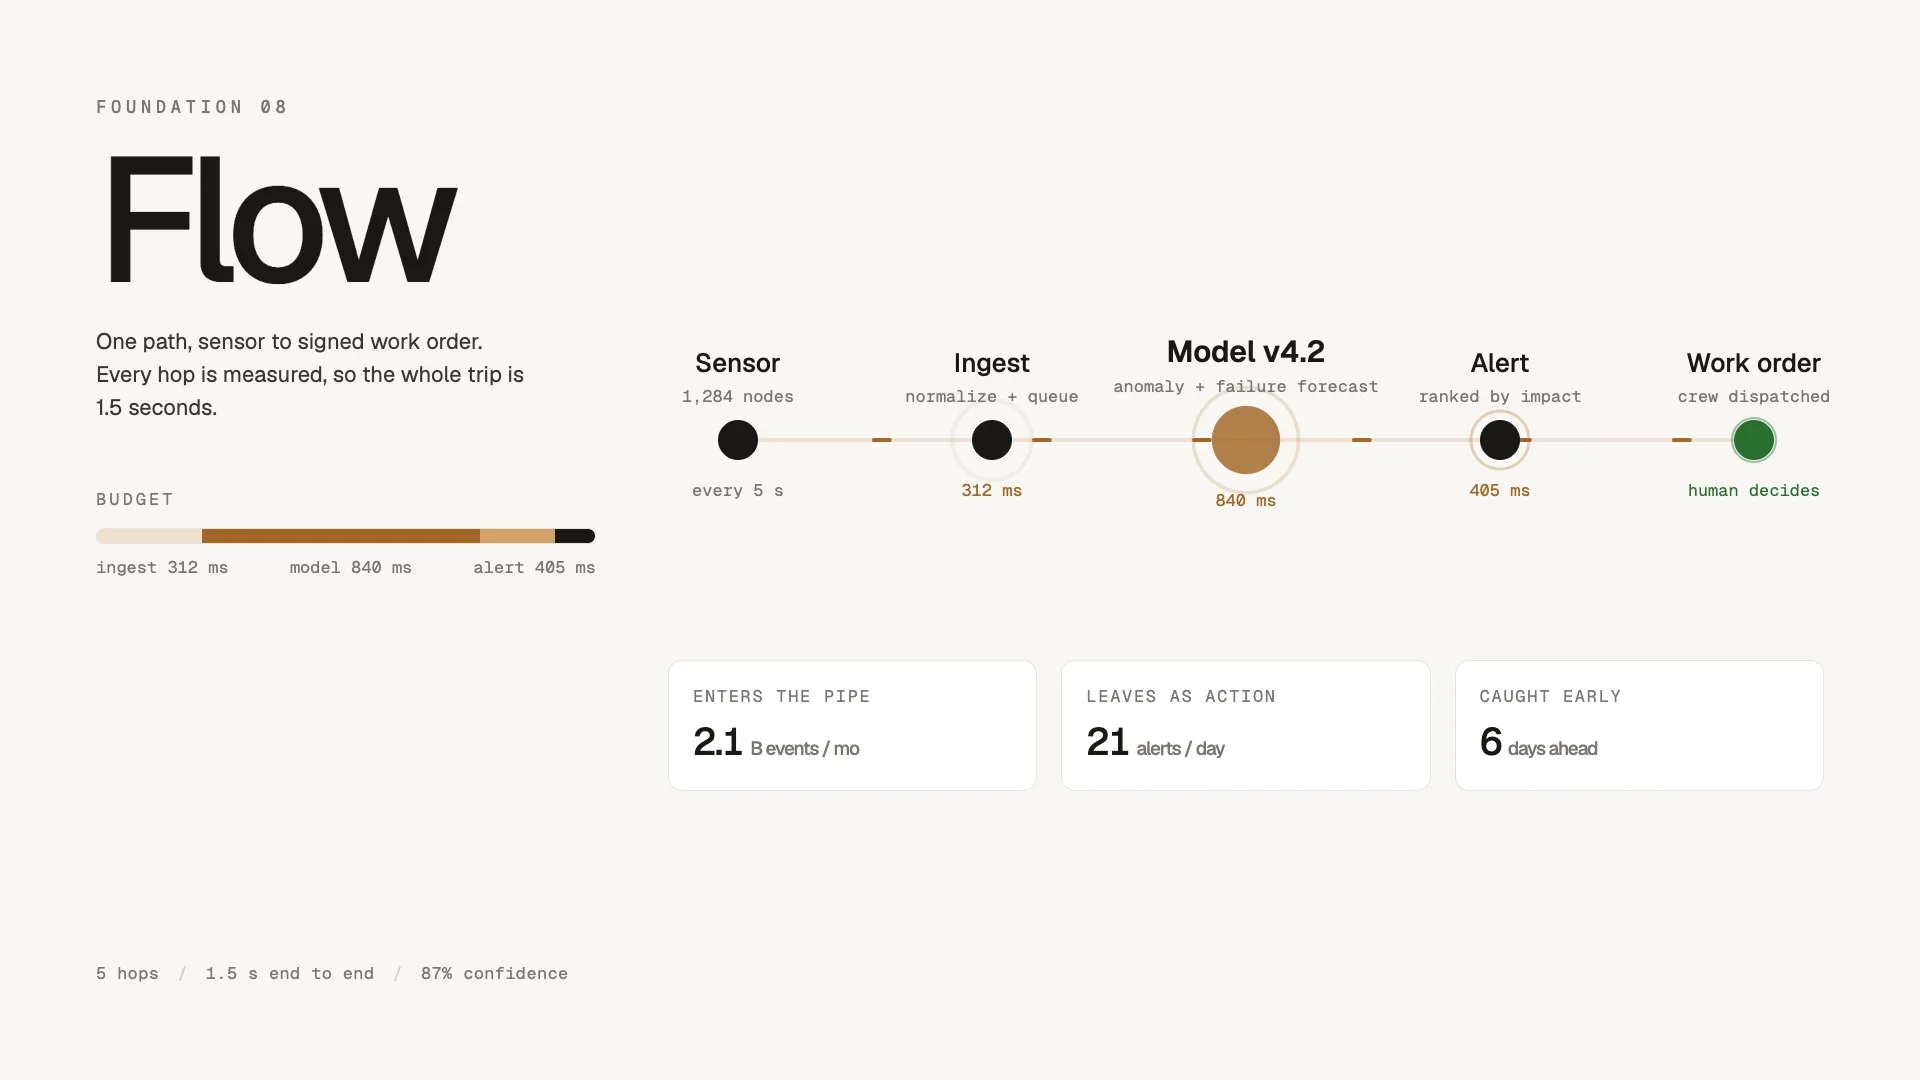
The whole product is a single path, and every hop is measured.
2.1 billion events go in every month. Twenty-one alerts come out per day. That compression is the entire product: the value was never in collecting the telemetry — everyone already did that — but in throwing away 99.99% of it and standing behind what is left.
The last hop is not the machine's. The model ranks alerts by impact and proposes a window; who goes out to fix it, and when, is decided by a person.
- In
- 2.1 B events / mo
- Out
- 21 alerts / day
- End to end
- 1.5 s
- Caught early
- 6 days
The visual system
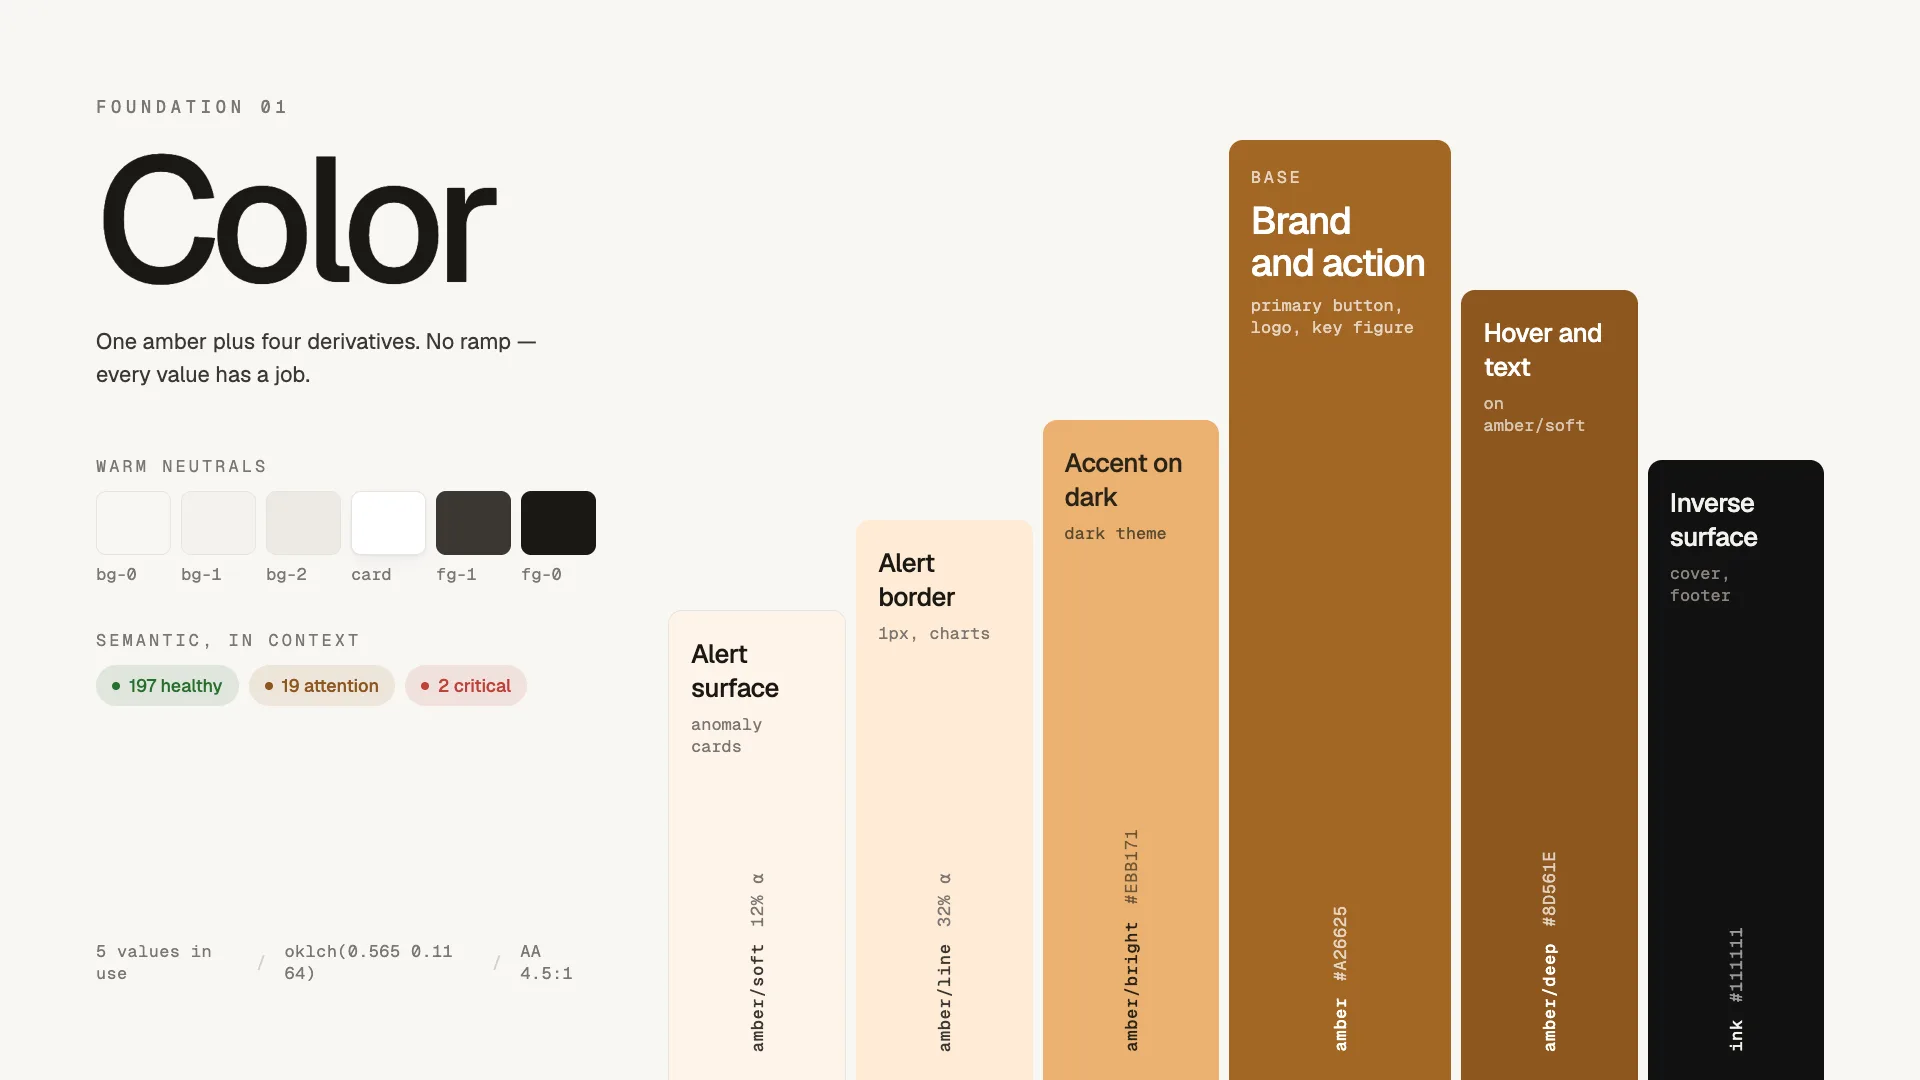
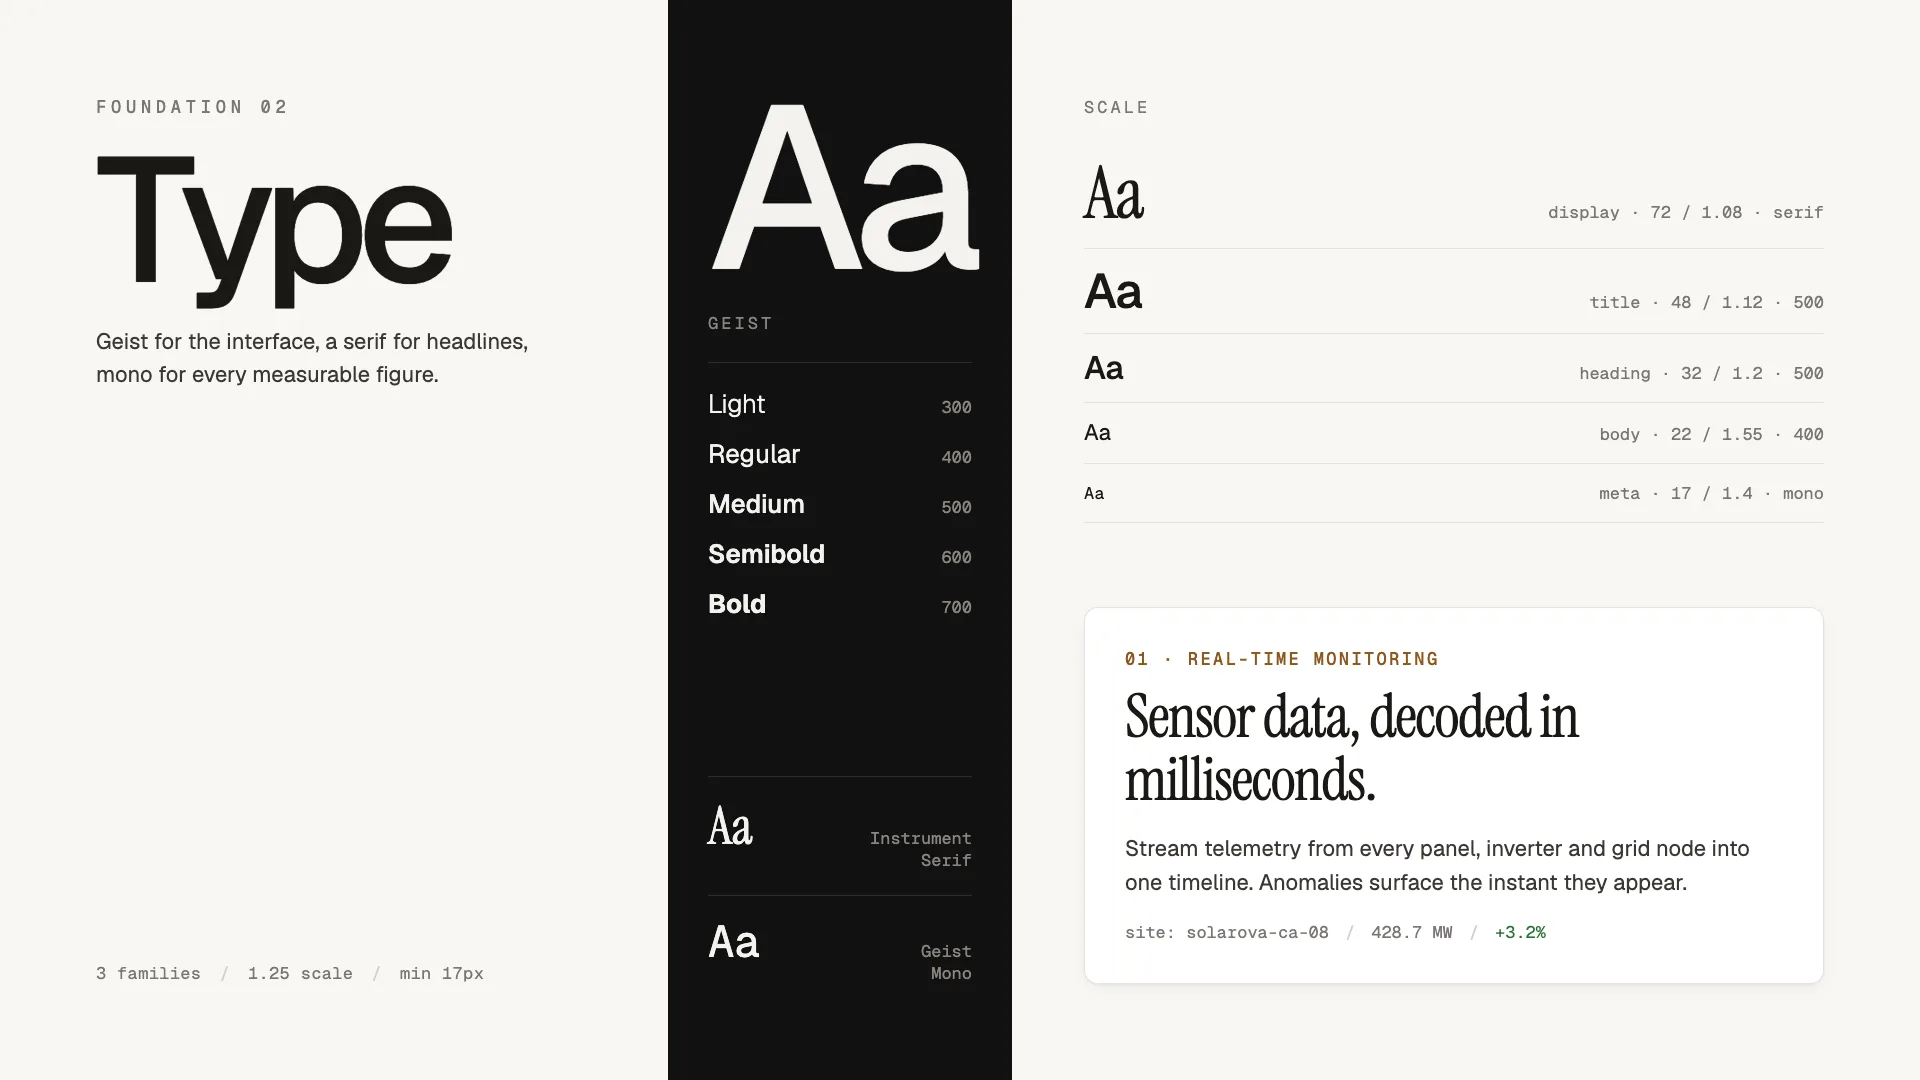
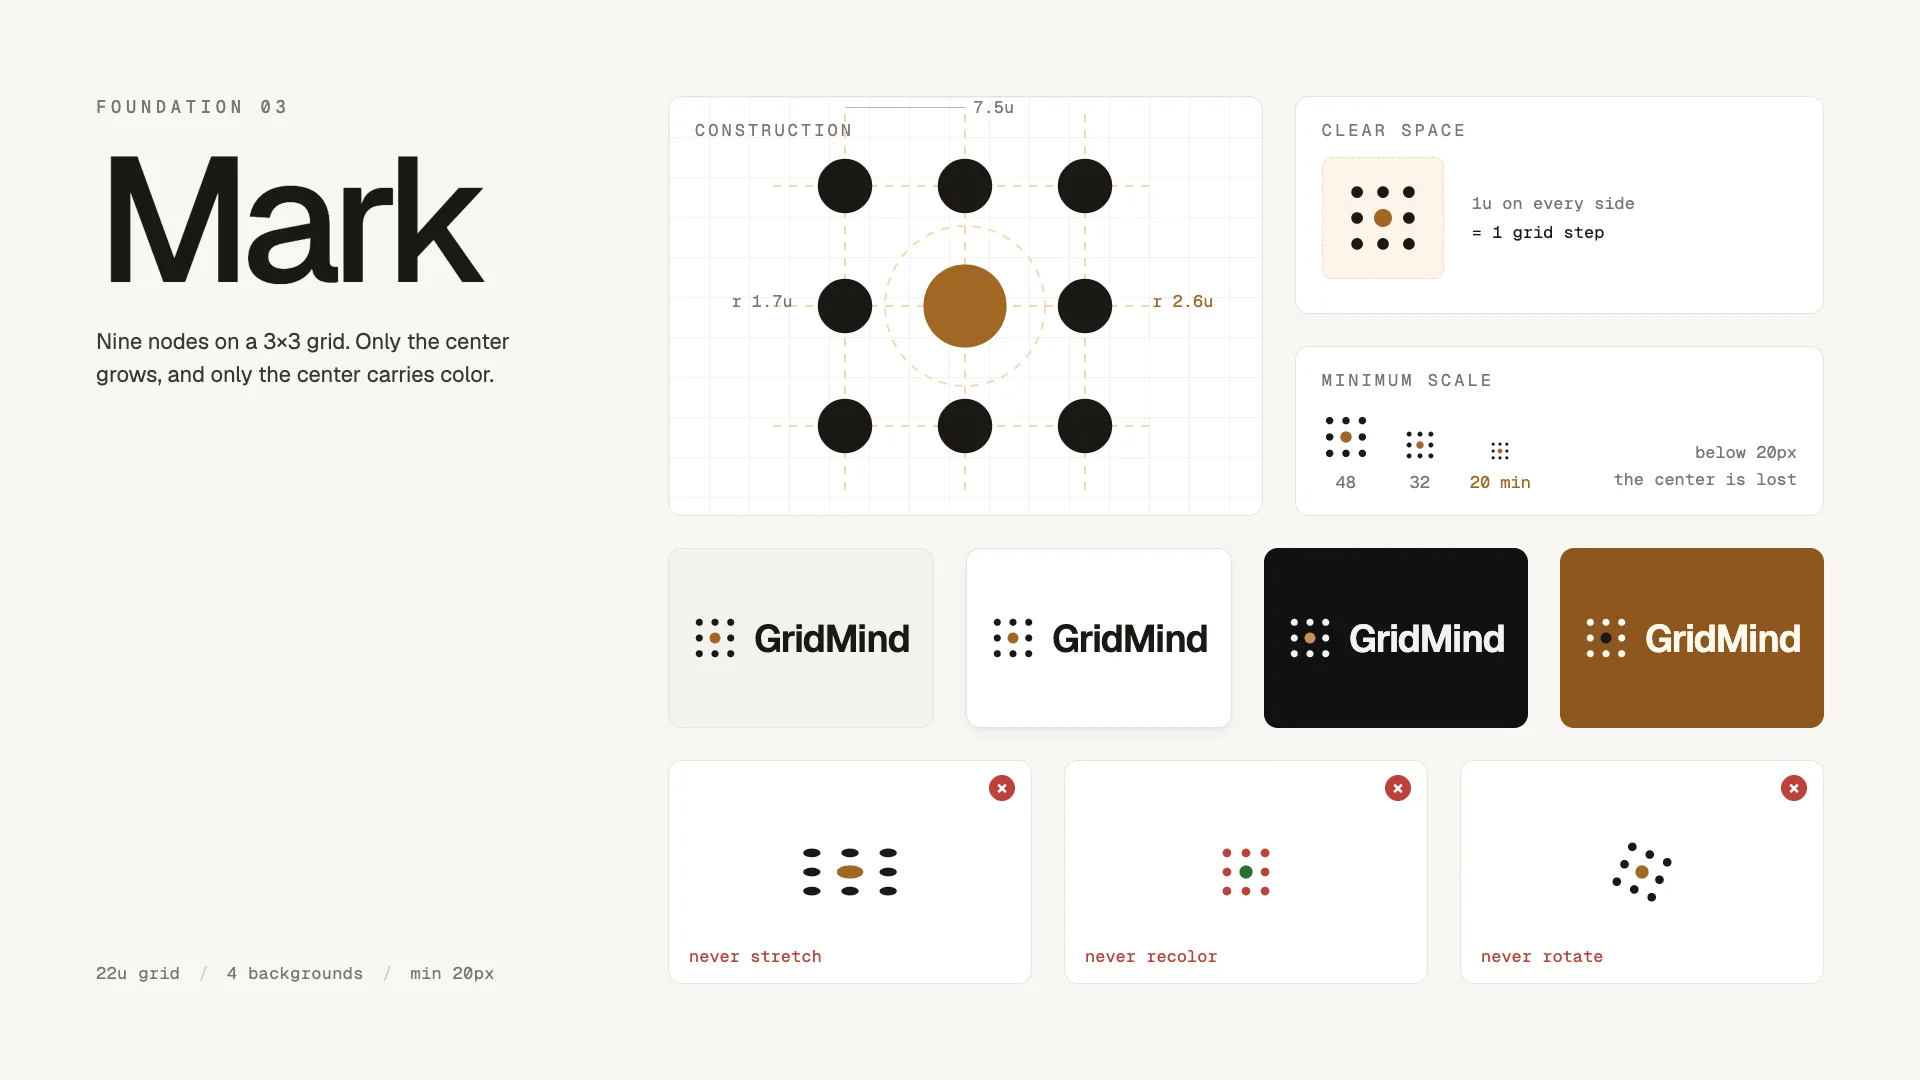
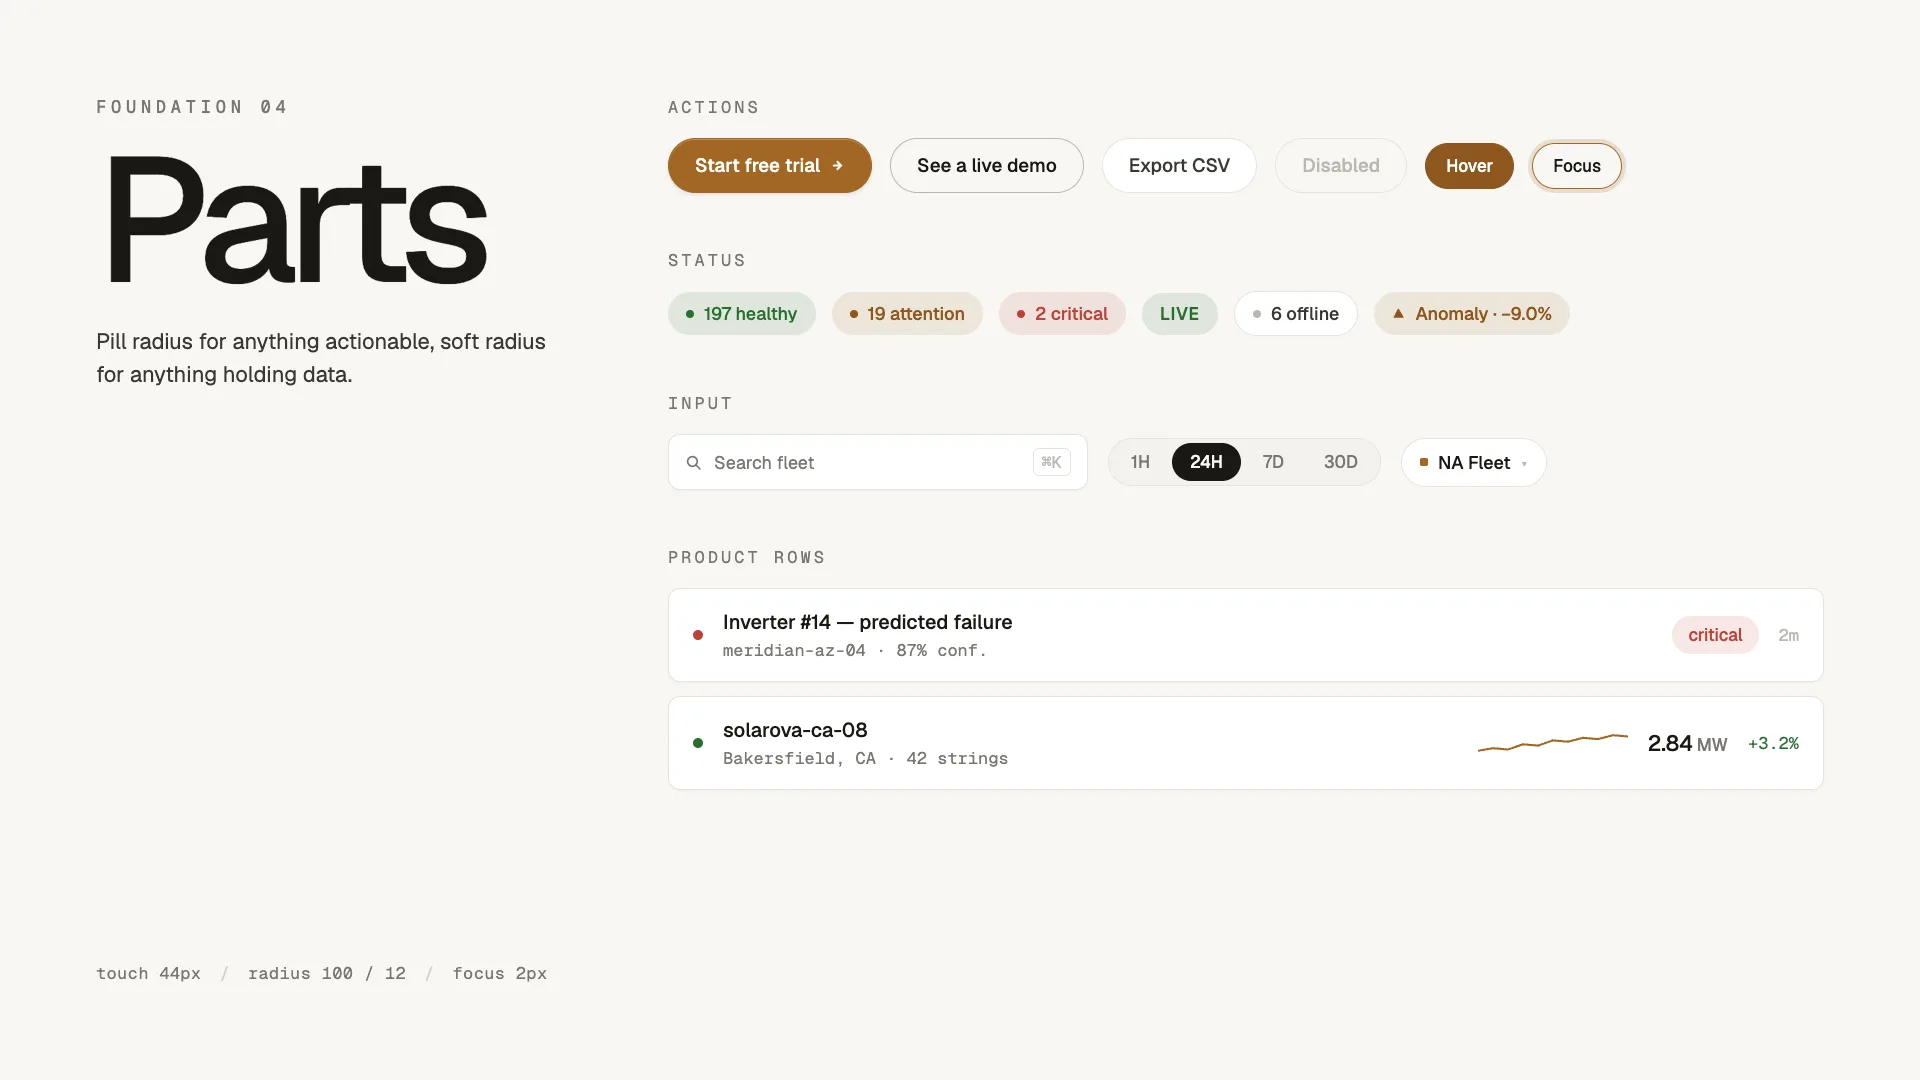
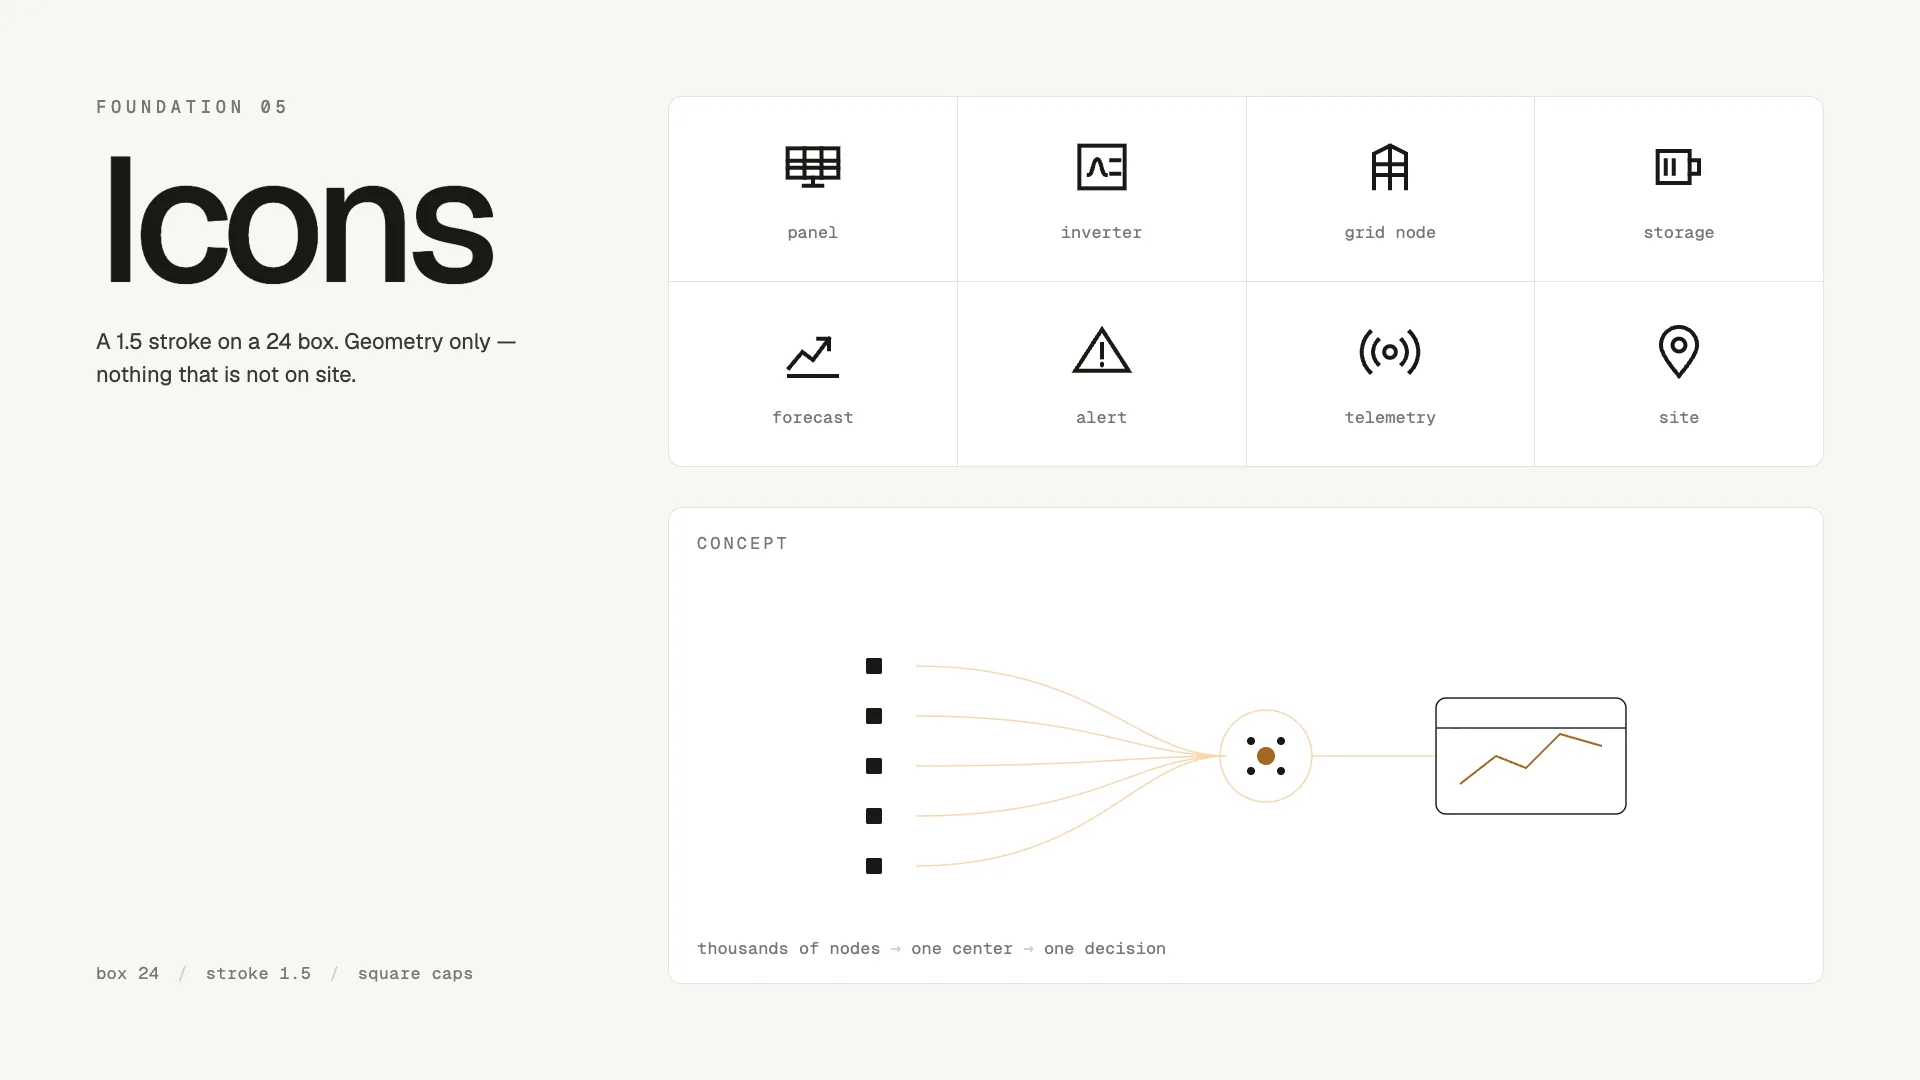
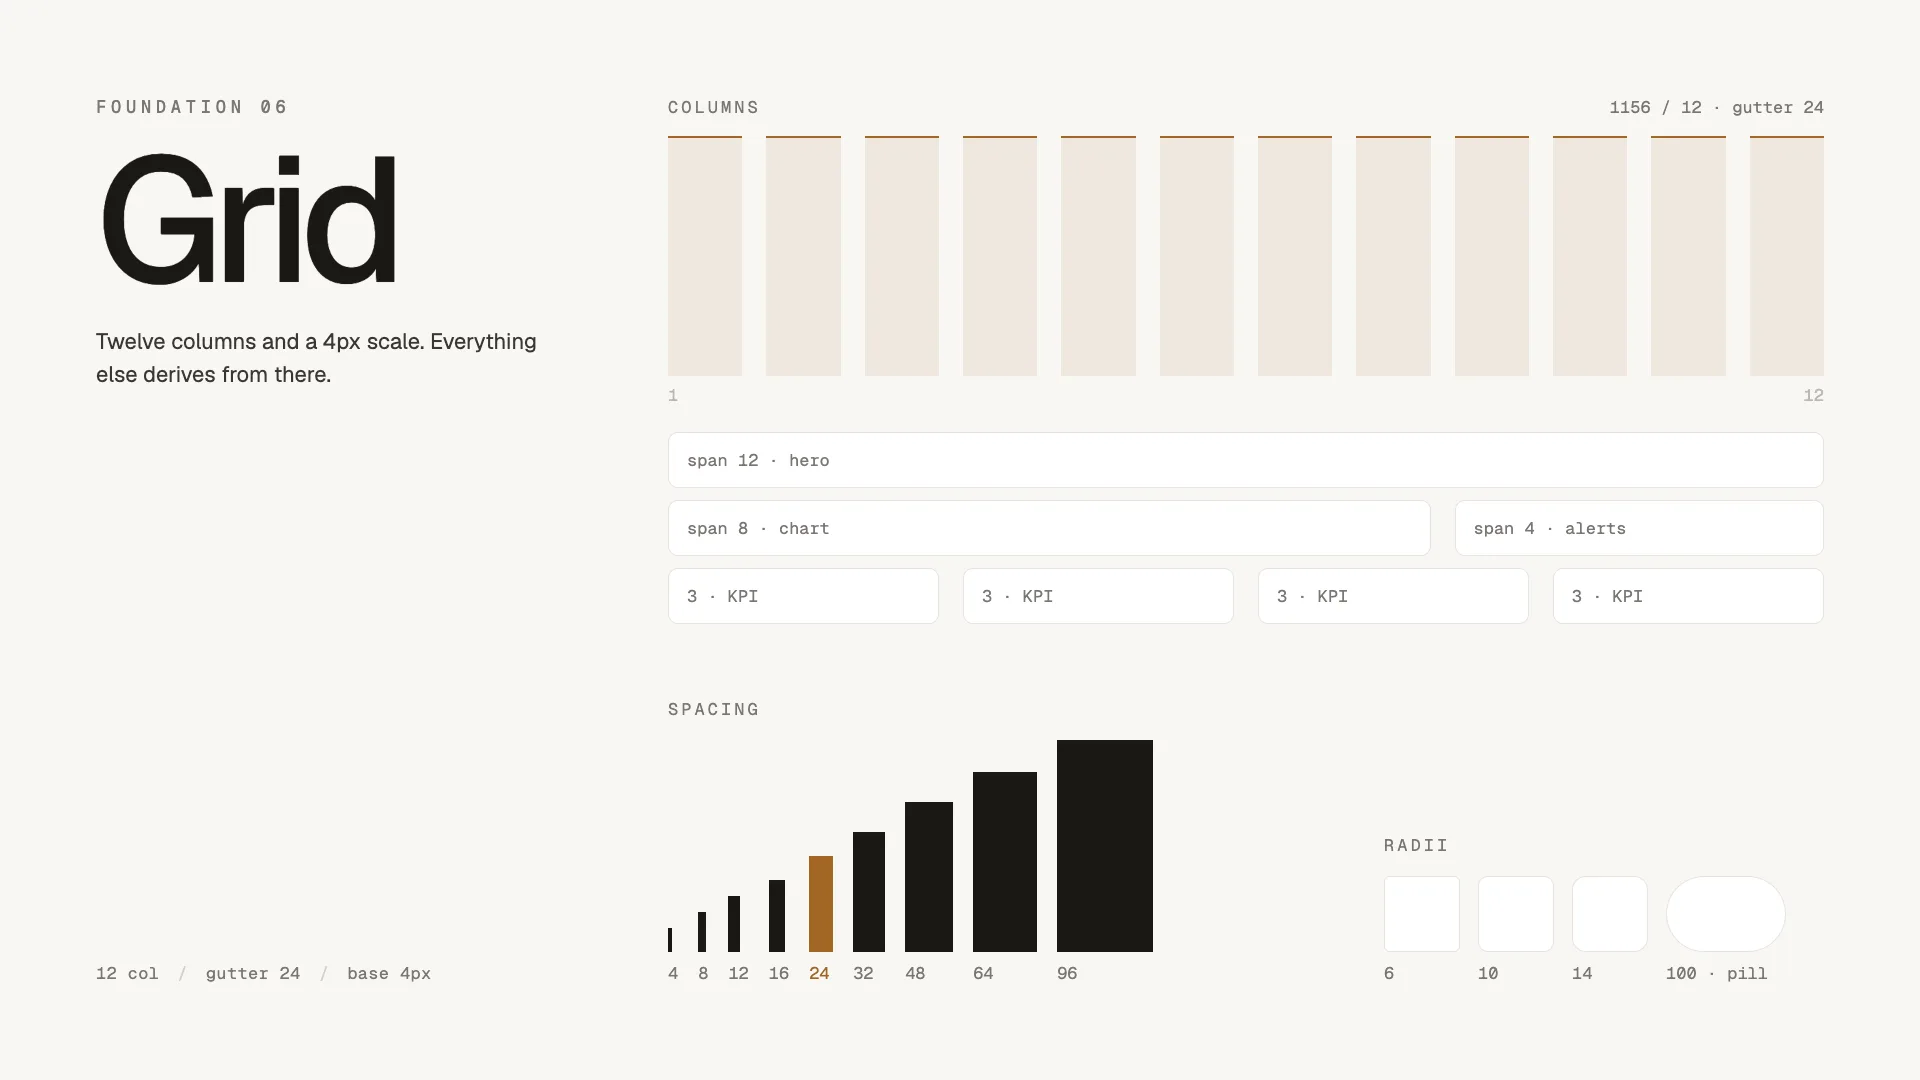
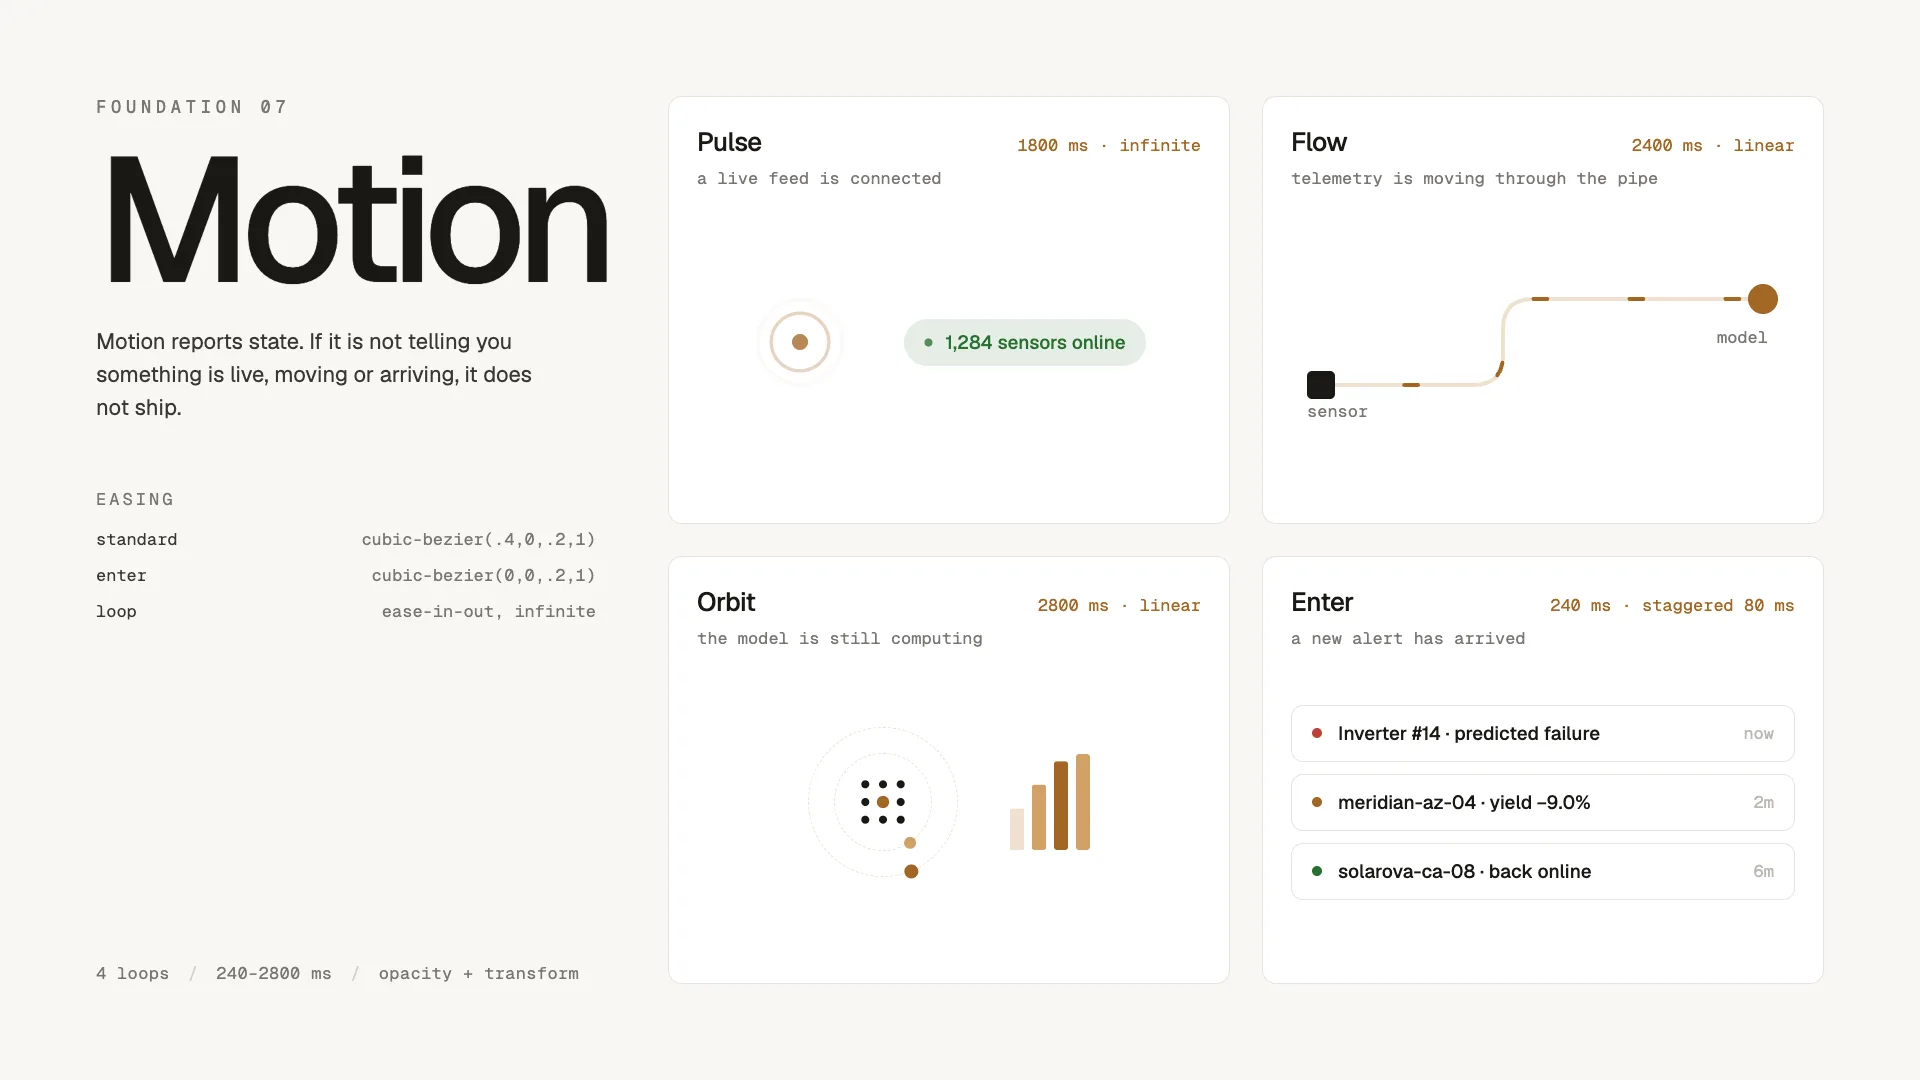
One amber and four derivatives, three typographic jobs and a nine-node mark. Seven plates from the manual, to be stepped through sideways.
The system in use
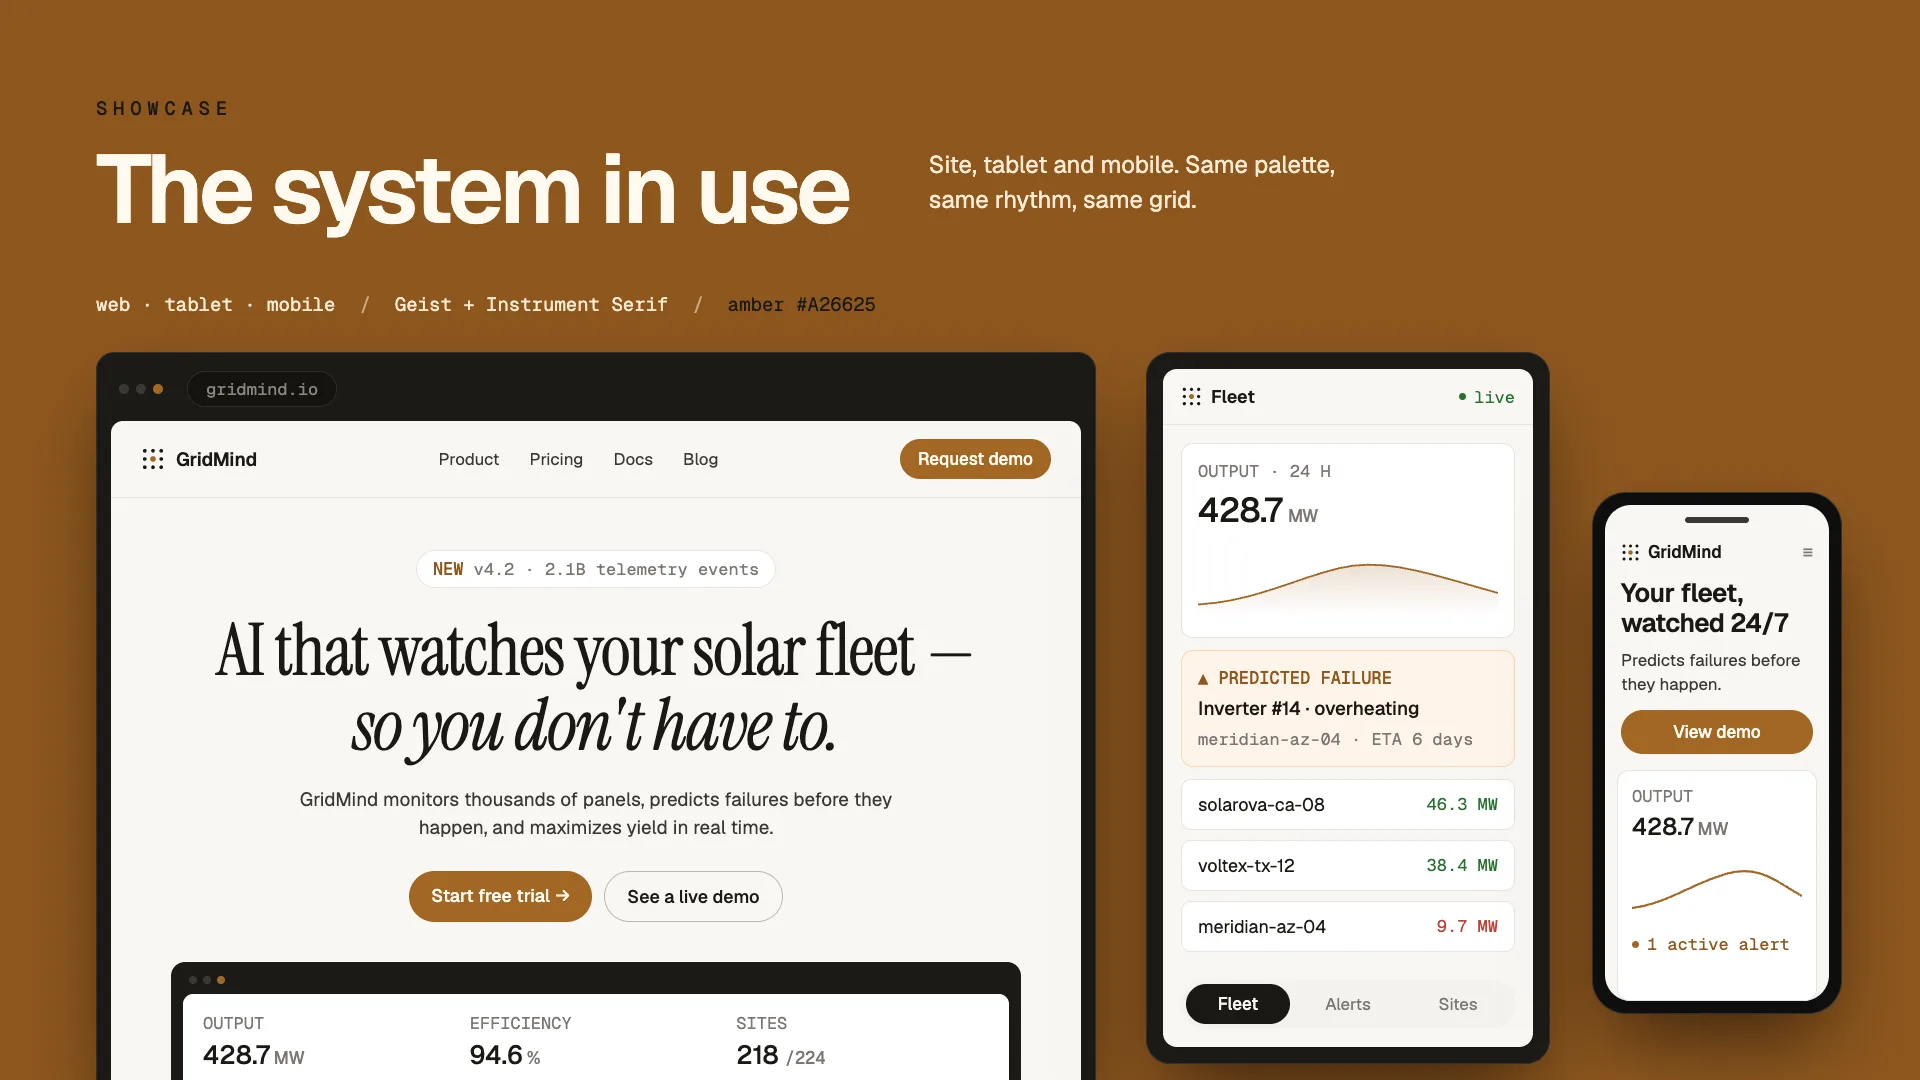
Web, tablet and mobile share palette, rhythm and grid. On the phone almost everything drops away except the one thing that matters at three in the morning: what is failing, and whether you have to get up.